As I talked about in my somewhat serious and somewhat lighthearted How We Saved 20% On Our Around-The-World-Trip post, starting last summer the US Dollar took off against most of its global trading peers and hasn’t looked back. The Japanese Yen, the Euro, the Australian and New Zealand Dollars, and even the Nigerian Naira and the Nicaraguan Córdoba… all are weaker against the US Dollar. The story has been a strong Dollar across the board, which has been very nice for the “travel side” of Backpack Investing as we withdrew cash from ATMs, paid for hotel rooms, and booked flights in these weakened local currencies. 1<- – – Click this little footnote.
And while the recent strength in the US Dollar has certainly benefited us directly in financing this trip, it’s not the only way we’ve been affected. Lately, a lot of potential investments have come back onto my trading radar2 as a result of the stronger Dollar.
But not just potential currency trades. Multiple global stock markets, entire sectors, and even individual securities have sold off sharply in recent months and are now back on our watch list. In many of those cases, I strongly believe the weakness in those markets it is a direct result of what is happening with the US Dollar.
So I wanted to write a post to address that… which I think is best to break into two parts. First, in this part we’ll take a look at why currencies move the way they do. What exactly is behind those changing rates? Then, in Part 2, we’ll look at where they may be going next. 3
Why currencies move the way they do.
Now. This might sound like a complicated topic. And so I was struggling with how to best address this in a blog post… since it could be4 the topic of entire books. But I think if we can break down a few general themes that affect currency movements, then this just might be manageable. We can hopefully simplify this into a common sense discussion and then (again, hopefully) make it relevant to general investors.
And so to start, I guess we should begin by admitting that there are a lot of complicated things going on behind the scenes of those flashing buy/sell quotes on the FX exchange board. Starting with a lot of fancy sounding economic data releases that are market moving.
Here are some fancy-sounding economic data releases that are market-moving…
There are enough of these **major breaking news** data releases to give any investor a headache. No matter what hour of the day or what market you are trading, there is probably some economic statistic, government report, or other market-moving release happening.5 Here’s just a sample of them:
- Consumer Price Index (CPI)
- Balance of Trade
- Debt-to-GDP ratios
- Inflation readings
- New home sales
- Existing home sales
- Employment statistics
- Producer Price Indexes (PPIs)
- Retail sales
- New loans
- Labor productivity
- 1980s cover band bookings67
- M2 money supply
- GDP growth rates
- Purchase Manager Indexes (PMIs)
- Foreign exchange reserves
- and last but not least… the Zentrum fur Europaische Wirtschaftsforschung (or “ZEW”) report.8 9
So that’s a lot of news releases to follow. And it would make your head spin to try to do so.
…But luckily most investors don’t need to worry about them.
For example… here’s the crazy, wild, flashing-lights reaction in the Euro to US Dollar exchange rate when the last monthly US Employment Report was released on August 7:
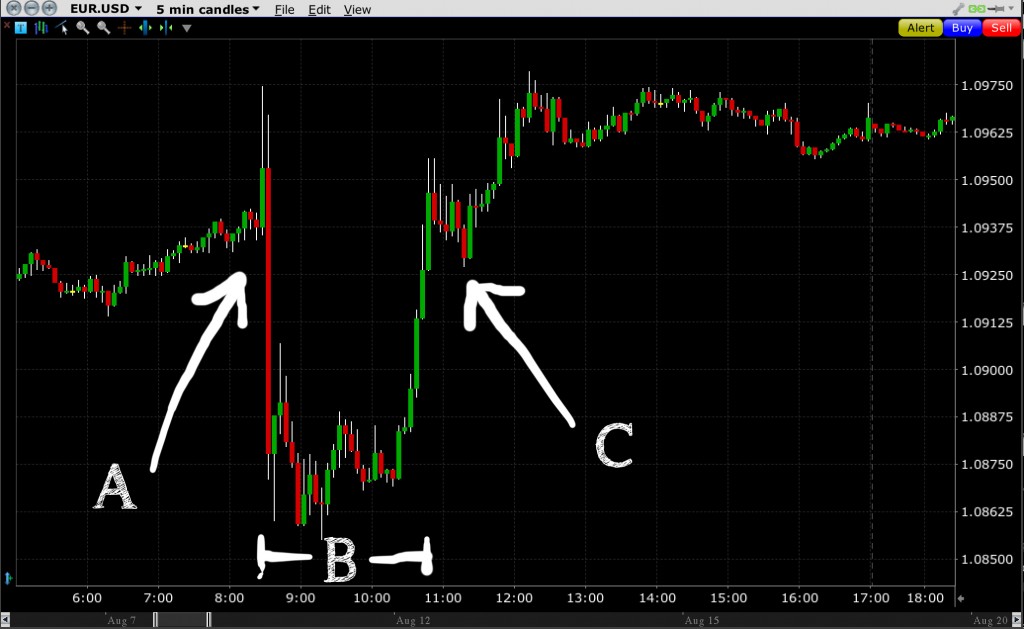
A: Payroll report released at 8:30 am EST. Market goes nuts as quantitative algorithm-based high-frequency trading firms start selling euro before the humans even know what is happening.
B: A few hours pass, market and normal people digest data.
C: Market decides that it freaked out too much, returns to basically where it started the day.
But… unless you are a day trader, currency scalper, or just a super-nerd like me… you probably wouldn’t have noticed this movement. Because on a year-to-date chart of EURUSD, here’s what that “wild” movement looked like:
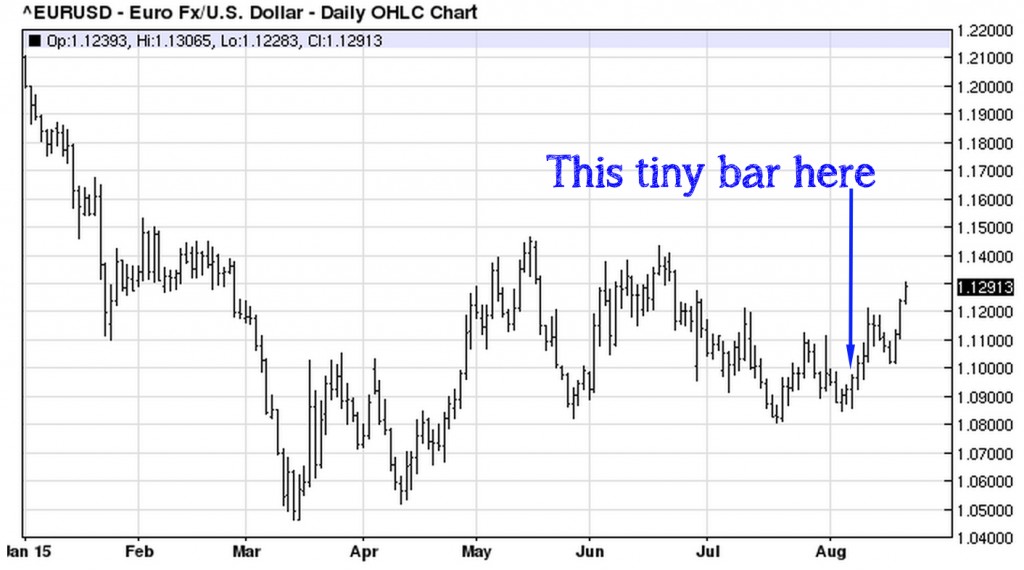
So all that action in the prior 5 minute chart – that dozen or so red and green bars – is basically just that tiny, insignificant bar on this year-to-date chart. In other words, it barely registers.
Although there is a lot of economic data that is contributing to those constantly moving FX rates, most investors shouldn’t care and don’t need to follow these individual releases.10 Instead, most individual investors can ignore all those individual economic reports and take a step back to focus on a single item: interest rates.
Because interest rates are the single most important factor in currency fluctuations.
While all of those other economic releases above can (and do) move markets… the single most important factor in determining currency movements is the interest rate set by a country’s central bank. By strategically adjusting constantly tinkering with interest rates, central banks around the world are able to influence capital flows, trade balances, and inflation by strengthening or weakening the currency as they see fit.11
In fact, we can think of interest rates as a way to easily summarize all of those other data points.12 Said differently, changes in interest rates typically come as a result of all of those other data points.
For example… let’s say that many of those other numbers in the list above are all looking good. Employment is up, new home sales are booming, PMI reports indicate new industrial orders are strong, GDP is growing rapidly, consumer spending is boosting retail sales reports, etc. The result is that if the economic growth captured by these reports is strong enough… the central bank will typically need to raise interest rates at some point to keep inflation in check and to prevent the economy from overheating (and creating a bubble). And, of course, the opposite would obviously be true as well.
If a country has unemployment problems, consumer spending is low, industrial activity is weak, banks don’t see demand for new loans, etc… then the central bank is probably not worried about inflation and would instead be lowering interest rates to boost economic growth (and to stoke an acceptable level of inflation).13
And so by focusing on interest rate movements… an investor can typically get a summary view of all of those other economic data points and gauge the overall health of an economy.14 This makes interest rate analysis a very useful tool, not only for currency traders, but for investors in general.
Case in point…. just try to turn on Bloomberg or CNBC – or to read just about any article in the financial press – right now without hearing debate about the Fed’s upcoming meeting in September.
Interest rates drive global capital flows, affecting currency exchange rates.
So now that we have established that interest rates are important, let’s try to discuss why.
Interest rates are very important to investors, and all types of financial markets are affected by the rates set by the world’s central banks. These changing interest rates result in trillions of dollars of capital moving from country to country. On a daily basis.15 So let’s try to take a closer look at this concept of capital flows.16
Fortunately, you don’t have to be a currency trader to have experienced this. You just need a bank account. Ask any Grandma in America and she can probably tell you that interest paid on savings is – and has been for many years now – quite terrible. Grandma might own CDs, treasury bonds, municipal bonds, Walmart corporate bonds, or some combination of those. No matter what the mix, the result is probably the same. Grandma shakes her head when she gets the statement each month. ‘Cause those monthly payments ain’t what they used to be.
And so when the US (and others) take interest rates down to almost nothing, Grandma isn’t happy. And investors are not happy. And when investors are not happy, their capital reacts accordingly.
By going where it will be treated better.
And I believe the best way to explain this concept is to use a real example.17 So readers, meet my friend the Brazilian Real. As a result of the 2008-2009 financial crisis, the US and others took interest rates to zero to fight the collapse in economic activity. And, as you already know, that meant that returns on savings were quite low. So for many investors it was not very appealing to buy a bond for something like 1%, maybe 2% if you were lucky, or 4% if you were buying high-yield or junk. For most of these investors, during the last decade they were able to earn that on a good money market account, so these new low rates were unacceptable.
So what happened? Capital wanted to be treated better, and so it started looking for a better home. And one of the many places it found was Brazil.
You may already know the story… commodity prices quickly recovered, there was chatter that all the “money printing” would cause inflation around the world, economic activity started to rise, and “emerging markets” were again all the rage. And so money started pouring into Brazil. Like this:
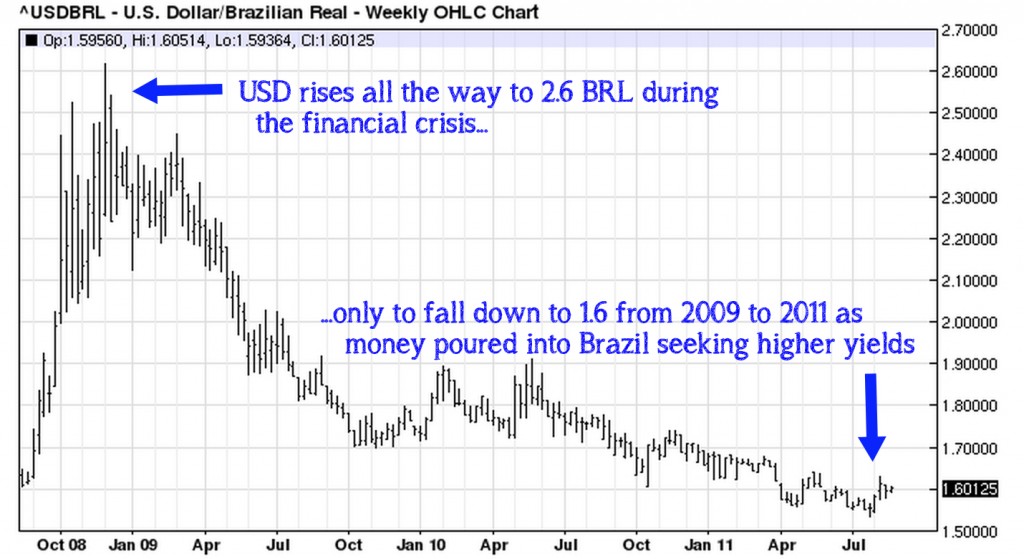
Note: For this pair, the Brazilian Real (“BRL”) is the base pair, meaning that “up” on the chart is Dollar higher and Real lower. So when the chart goes down…. that is the BRL strengthening (and the USD weakening).
As this chart shows, once the panic left financial markets in early 2009… investors moved from protecting their capital to again wanting a better return on their capital. So money poured into Brazil, increasing demand for Real, and moving the exchange rate in the US Dollar:Brazilian Real from 2.6 in 2009 to 1.6 in 2011.18
And so the result of all this money flowing into Brazil in search of yield was rapid appreciation in the Brazilian Real. So much so, that by 2011 Brazil actually started worrying about its currency getting so strong. All of the investment capital flowing into Brazil in the quest for a higher yield was causing Brazil’s currency to rise too quickly. 19
It was all over the news. Important global economists were talking about it, the Brazilian government was losing sleep over it, and you couldn’t buy a condo in Miami without getting into a price war with a Brazilian.
So who’s fault was all this?
Well. Basically. Everyone found it easy to blame the US.
Because if interest rates are the most important factor in global currency movements, and the world’s largest economy – which happens to control the world’s global reserve currency – is running a zero interest rate policy… that was a really big deal and caused major waves throughout the global financial system.
What goes up, must come down.
But this story is not unique to Brazil. Most emerging and frontier markets saw massive capital flows into their equity and bond markets as investors left the sub-1% world of the “West” to look for better yield elsewhere. Sure, there was plenty of real economic growth in those markets which made them an attractive place to park capital. But there was certainly more “hot money” flowing to these markets as well due to the zero interest rate policies of the US, Europe, Japan, and others.
So if we can understand that the Fed running a 0% interest rate policy for the past five years sent all that investment capital chasing a higher yield in other markets… shouldn’t we stop to think about what might happen whenever the Fed changes that policy? What might happen when that “hot money” starts to leave?
Well, currency traders and some globally-focused investors have been seeing it for over a year now. The result is the wild rise in the US Dollar against almost every other currency that we’ve been talking about. (Remember our 20% savings on our trip..?)
So after almost a year of a rising Dollar, two thing are happening: First, the rest of the world is feeling the effects of a weakening currency.20
But secondly, and more importantly, much of that investor capital that left the safety and 0% rate of the US Dollar in search of higher yields the past five years is now leaving those markets to come home. And the results have been quite severe, as you’ve probably noticed if you’d watched any financial news the past few weeks.
Remember our friend the Brazilian Real? How it strengthened from about 2.6 to 1.6 to the Dollar from 2009 to 2011?
Well, I was being a little sneaky when I cut that chart off in 2011 just to illustrate my point. Because what goes up, must come down. Let’s see what the Real has done since then:
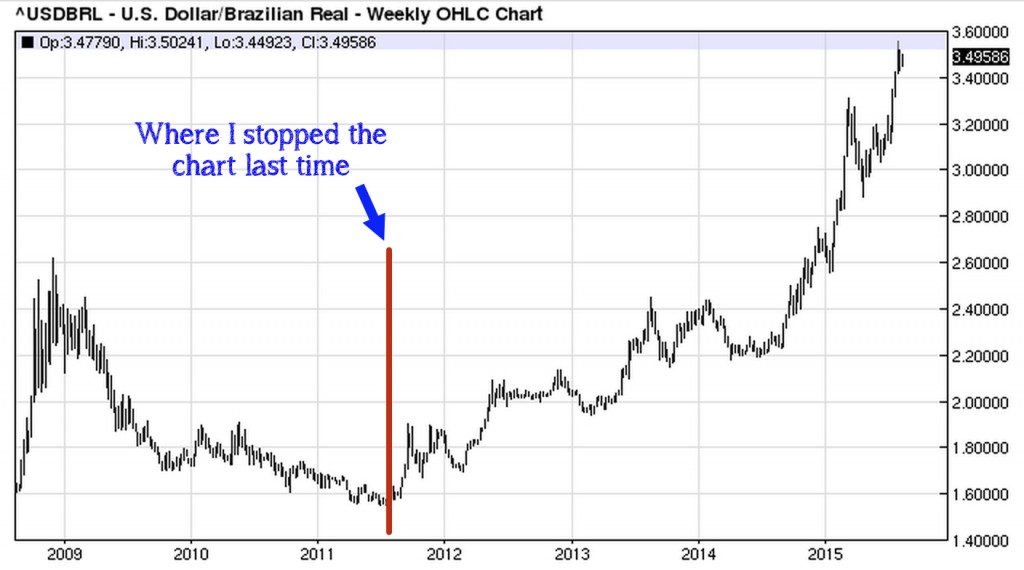
Again for this chart… higher means Dollar up & Real down. Lower means Dollar down & Real up.
Yeah. Exactly. After strengthening all the way from 2.6 to 1.6 and prompting all those articles about how the world was ending, Brazil needed to weaken the currency, and eventually Miami would be Rio2.0… well, guess what?
The Real plunged as the trend reversed and the “hot money” stopped flowing into Brazil and started to flow out. After going from 2.6 to 1.6… the Real completely reversed course and now a Dollar will fetch you almost 3.5 Reals. In fact, Brazil’s problem has gone from how to weaken its currency to how to stop the Real’s plunge. So for lack of a better way to say it… what went up, had to come down.
And it’s not just the Brazilian Real. Most emerging and frontier market currencies have been crushed by a strong Dollar over the past year.21
But if we said a meteoric rise in these other global currencies and markets was the result of five years of US 0% interest… then isn’t it normal to expect a fall in these same markets now that the Fed is widely expected to begin hiking rates?
Well… not necessarily.
I actually believe that this time the markets are over-reacting. I think this capital is leaving those global currencies and markets quite harshly in expectation of a new environment of rising interest rates.
And I think it is wrong to do so.
This might just be the opportunity I have been waiting for.22
Which… we’ll address in Part 2 of this series.
Thanks for reading,
Christopher
Position Disclosure: Long EUR.USD and short USD.NOK at the time of writing, both in BGIP and in personal retirement accounts.
The BackpackInvesting.com & BGIP Disclaimer
All market commentary and any other financial references featured on BackpackInvesting.com represent the opinion of the author and are not be construed as investment or trading advice. Such articles and commentary are not meant to be a solicitation or recommendation to buy, sell, or hold any securities mentioned. In the event that the author has an interest in any security mentioned, that position will be disclosed at the time of writing, both for the accounts of Brentwood Global Investment Partners, LP (“BGIP”) and for the author’s personal accounts.
These little boxes are where I try to explain something in more detail in case it’s new to the reader. Other times I’ll just try to make a funny comment. You’ll just have to click to know which… ↩
or should I say Tradar? ‘Cause it’s trading radar? No? Ok, moving on… ↩
…and what we hope to do about it. ↩
and is ↩
…or if not happening, it is pending. ↩
Not a real thing. Just seeing if you were paying attention. ↩
…actually, if that’s not an official report, it should be. ↩
Gesundheit ↩
No, seriously. We can thank zee Germans for this one. It’s a real thing and is actually kind of an important release.↩
…but for those that do, I use this cool little calendar to track and follow this nerdy stuff if you want to check out the latest info. It’s a very handy page that lists the country, release item, expected number, actual number, and has links to the official reports. ↩
There are, of course, examples of where a country loses control with spiraling inflation or deflation, but those examples (like Venezuela’s disastrous inflation now, or to a much lesser extent the current inflation pressures in Iran or Brazil) are outside of the context of this post.↩
…which is one reason that I like to focus on them.↩
…because a little inflation is a good thing; deflation is much more dangerous and problematic for central banks. ↩
One very important footnote from above to repeat: If a central bank is raising interest rates to fight inflation that is out of control, well that’s a different issue and outside the context of this post. That’s an example of when rising interest rates would mean very bad things are going on…↩
The interbank or “FX” market is by far the largest in the world. Over $4 trillion per day changes hands… more than all of the world’s futures and stock markets combined.↩
…and try to make it relevant for general non-FX-nerd investors. ↩
or should I say a Real example. (wait for it…) ↩
… meaning that in 2009 $1.00 US Dollar got you 2.6 Reals but only got you 1.6 Reals in 2011. ↩
…which hurts big exporter countries like Brazil by making the costs of their exports more expensive.↩
Just google “currency war” and you’ll have plenty of reading to keep you busy.↩
…just review the “how we saved 20%” post for examples of these emerging market currency declines. ↩
as a nerdy currency trader who spends way too much time scanning these rates and charts. ↩